|
Examples /
DebuggingEmbeddedECLiPSeCodeDebugging embedded ECLiPSe codeUsually, the recommended way to development and debug ECLiPSe code, is to use either
These are both described in the user manual. Even when developing ECLiPSe code for an embedded application, the ECLiPSe component is best developed and debugged separately using one of these methods. However, it is also possible to use the debugging tools with embedded ECLiPSe code, but in this case the tools have to be explicitly loaded and started, as detailed below. ExampleAs an example, we will use the following C++ code: # File queens.cc
#define USES_NO_ENGINE_HANDLE
#include "eclipseclass.h"
int main()
{
ec_init();
// compile the application's ECLiPSe code
post_goal("compile('queens.ecl')");
EC_resume();
// run the goal: queens(8,Result),writeln(Result).
EC_ref Result;
post_goal(
term(EC_functor(",",2),
term(EC_functor("queens",2), 8, Result),
term(EC_functor("writeln",1), Result))
);
EC_resume();
}
which embeds the following ECLiPSe code % File queens.ecl
:- lib(ic).
queens(N, Board) :-
length(Board, N),
Board #:: 1..N,
( fromto(Board, [Q1|Cols], Cols, []) do
( foreach(Q2, Cols), param(Q1), count(Dist,1,_) do
Q2 #\= Q1,
Q2 - Q1 #\= Dist,
Q1 - Q2 #\= Dist
)
),
labeling(Board).
We compile the C++ using a command like g++ -o queens -I$ECLIPSEDIR/include/$ECLIPSEARCH
-L$ECLIPSEDIR/lib/$ECLIPSEARCH
-Wl,-rpath,$ECLIPSEDIR/lib/$ECLIPSEARCH
queens.cc -leclipse -lgmp
The environment variables ECLIPSEDIR indicates where the ECLiPSe system is installed, and ECLIPSEARCH is ECLiPSe's name for the processor/operating system we are running on. Other details depend on your operating system and C++ compiler. Running the compiled code should then give $ ./queens
[1, 5, 8, 6, 3, 7, 2, 4]
$
Using the command line tracer with C++ - embedded ECLiPSe codeTo use the tracer, load the # File queens.cc
#define USES_NO_ENGINE_HANDLE
#include "eclipseclass.h"
int main()
{
ec_init();
post_goal("lib(tracer_tty)");
EC_resume();
// compile the application's ECLiPSe code
post_goal("compile('queens.ecl')");
EC_resume();
// run the goal: queens(8,Result),writeln(Result).
EC_ref Result;
post_goal(
term(EC_functor("trace",1),
term(EC_functor(",",2),
term(EC_functor("queens",2), 8, Result),
term(EC_functor("writeln",1), Result))
)
);
EC_resume();
}
After recompilation, this should behave as $ ./queens
(1) 1 CALL queens(8, _264711) %> skip
(1) 1 *EXIT queens(8, [1, 5, 8, ...]) %> creep
S (511) 1 CALL writeln([1, 5, 8, ...]) %> creep
[1, 5, 8, 6, 3, 7, 2, 4]
S (511) 1 EXIT writeln([1, 5, 8, ...]) %> creep
$
The tracer stops the program when queens/2 is called, and in this example we have typed an s (skip) and three c (creep) commands. Variant: In order to run with the debugger, but stop at a later point, replace trace/1 with debug/1, and set a spy-point on the particular subgoal of interest: ...
post_goal("spy(labeling/1)");
post_goal(
term(EC_functor("debug",1),
term(EC_functor(",",2),
term(EC_functor("queens",2), 8, Result),
term(EC_functor("writeln",1), Result))
)
);
...
The debugger now stops at the first call to $ ./queens
spypoint added to ic_constraints:labeling/1.
Debugger switched on - leap mode
+(254) 2 CALL labeling([_264972{1 .. 8}, _264986{... .. ...}, _265000{...}, ...]) %>
Using the graphical development tools (tktools) with C++ - embedded ECLiPSe codeThe graphical development tools of tkeclipse can be run independently using the tktools command (part of a standard ECLiPSe installation). They can be attached to any running ECLiPSe code, including embedded code. On the ECLiPSe side, the library(remote_tools) has to be loaded in order to communicate with tktools. Modify the C++ code as follows: #define USES_NO_ENGINE_HANDLE
#include "eclipseclass.h"
int main()
{
ec_init();
post_goal("lib(remote_tools)");
post_goal("attach_tools");
EC_resume();
// compile the application's ECLiPSe code
post_goal("compile('queens.ecl')");
EC_resume();
// run it
EC_ref Result;
post_goal(
term(EC_functor("trace",1),
term(EC_functor(",",2),
term(EC_functor("queens",2), 8, Result),
term(EC_functor("writeln",1), Result))
)
);
EC_resume();
}
After recompilation, start the program: $ ./queens
Socket created at address localhost / 52091
The program displays a message like the above (containing your host name and a TCP port number), and stops, waiting for tktools to attach. Start tktools (either from the command line, or from a program menu). This will pop up a small window, asking for a TCP port number to be entered: 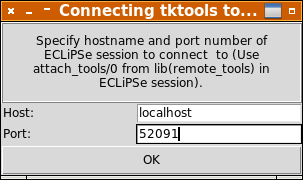 Enter the number displayed above and click ok. Your program should now start running, and the graphical tracer window should pop up, displaying the CALL queens(...) debugger port. The program can now be debugged in the same way as from tkeclipse. 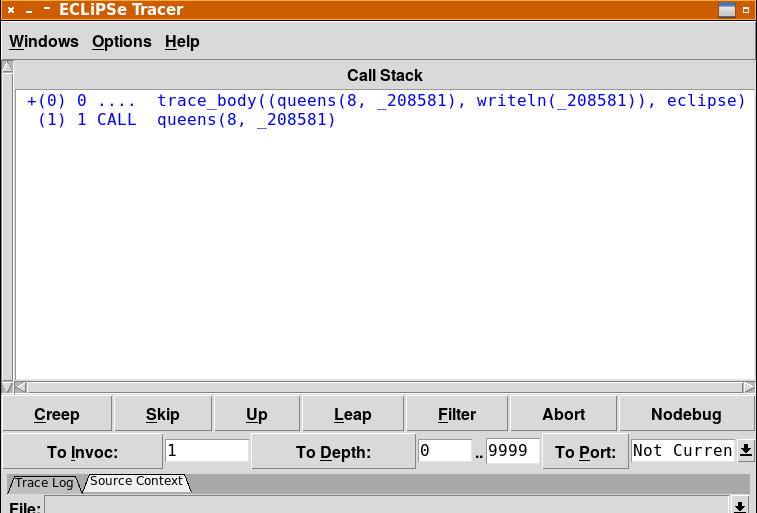 |