To visualise the viewables of an annotated program, the library lib(java_vc) provides a Java based graphical visualisation client.
A new Java visualisation client (Java VC) can be started from the tools menu of tkECLiPSe or using the predicate start_vc/1 in lib(java_vc). The single argument will return a unique name for the created client which can be used to close the client if required. While the Java VC is running, it will react automatically to the creation of viewables during ECLiPSe execution, but it cannot visualise viewables which were created before the Java VC was running.
When running a visualisation-annotated ECLiPSe program with a Java VC attached, control of the ECLiPSe process may pass between ECLiPSe and the VC throughout the program run. That is to say at certain key events in the program, ECLiPSe will pause in its running of the program and wait for user interaction with the VC before continuing. In such circumstances, the VC is said to hold the control.
Table 3.1 details the default behaviour for each of the visualisation events which may occur, and indicates whether or not this default behaviour can be altered.
Event Triggered by Default hold Alterable viewable creation viewable_create/2 viewable_create/3 viewable_create/4 yes no viewable expansion viewable_expand/3 viewable_expand/4 no yes viewable contraction Backtracked over a viewable expansion no yes viewable destruction Backtracked over a viewable creation yes yes forward update One or more elements in a viewable have been updated, ie. had their domain reduced or have been instantiated no yes backward update A forward update has been backtracked over no yes
Table 3.1: VC default behaviour for visualisation event.
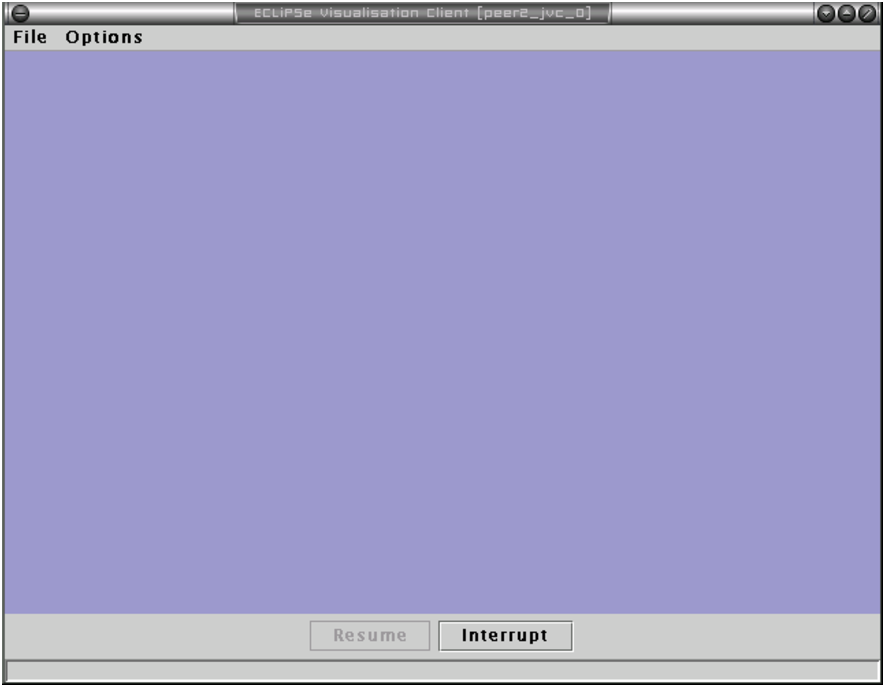
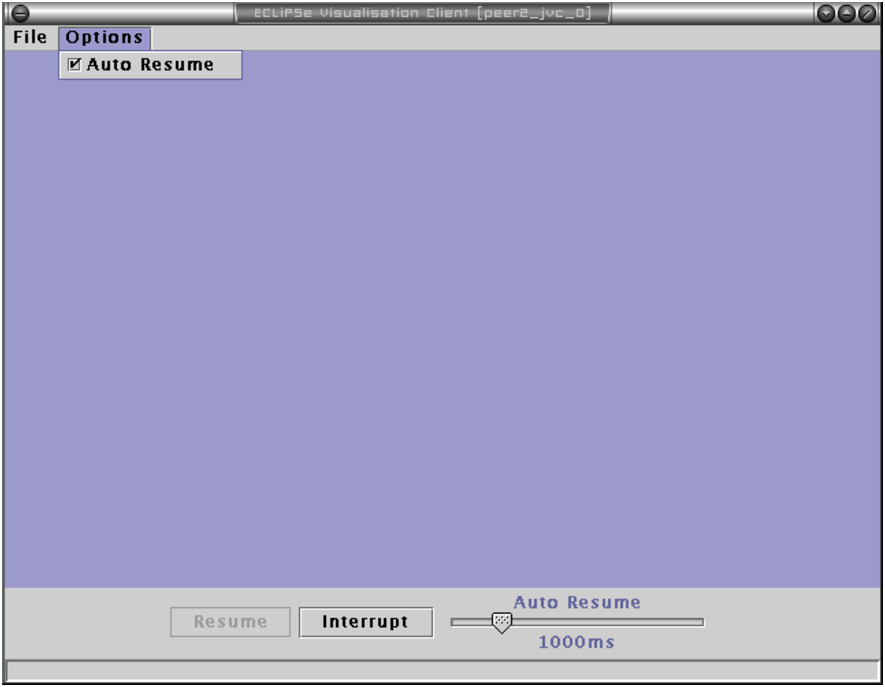
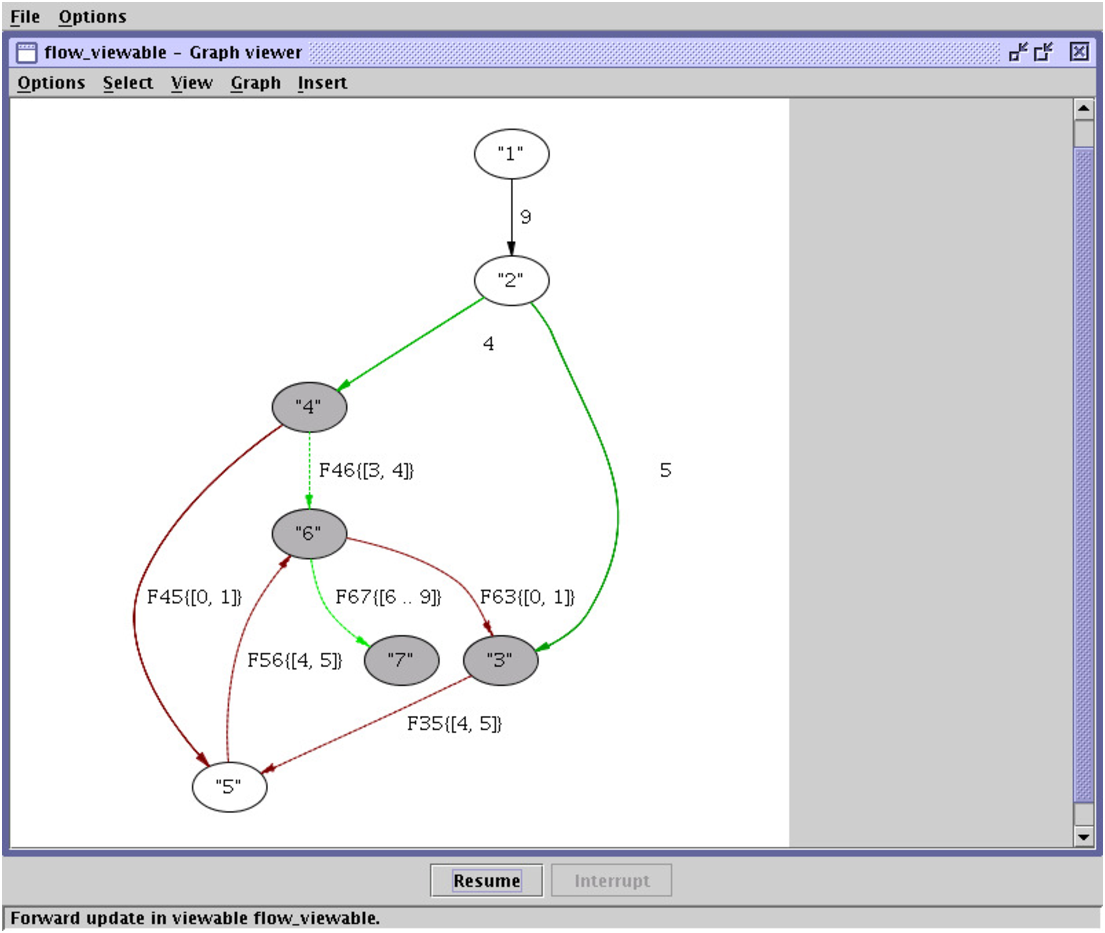
Should the VC hold, control can be passed back to ECLiPSe by pressing the Resume button at the bottom of the VC window, or by setting the auto resume timer. The Resume button and the auto resume timer are disabled when ECLiPSe has control, see Figure 3.2.
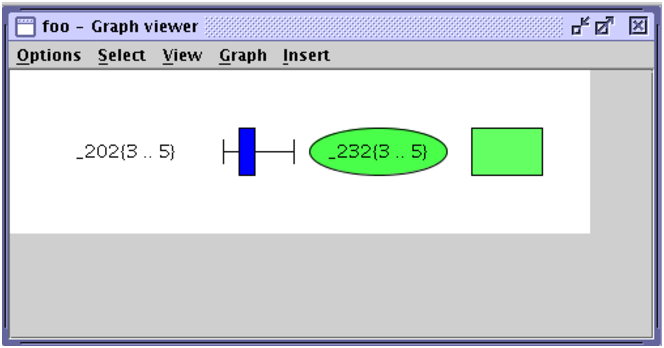
The Java VC provides many ways of visualising any single element of a viewable.
When rendered on the screen these representations are referred to as viewlets. Figure 3.3 shows the same variable rendered using a number of viewlet types.
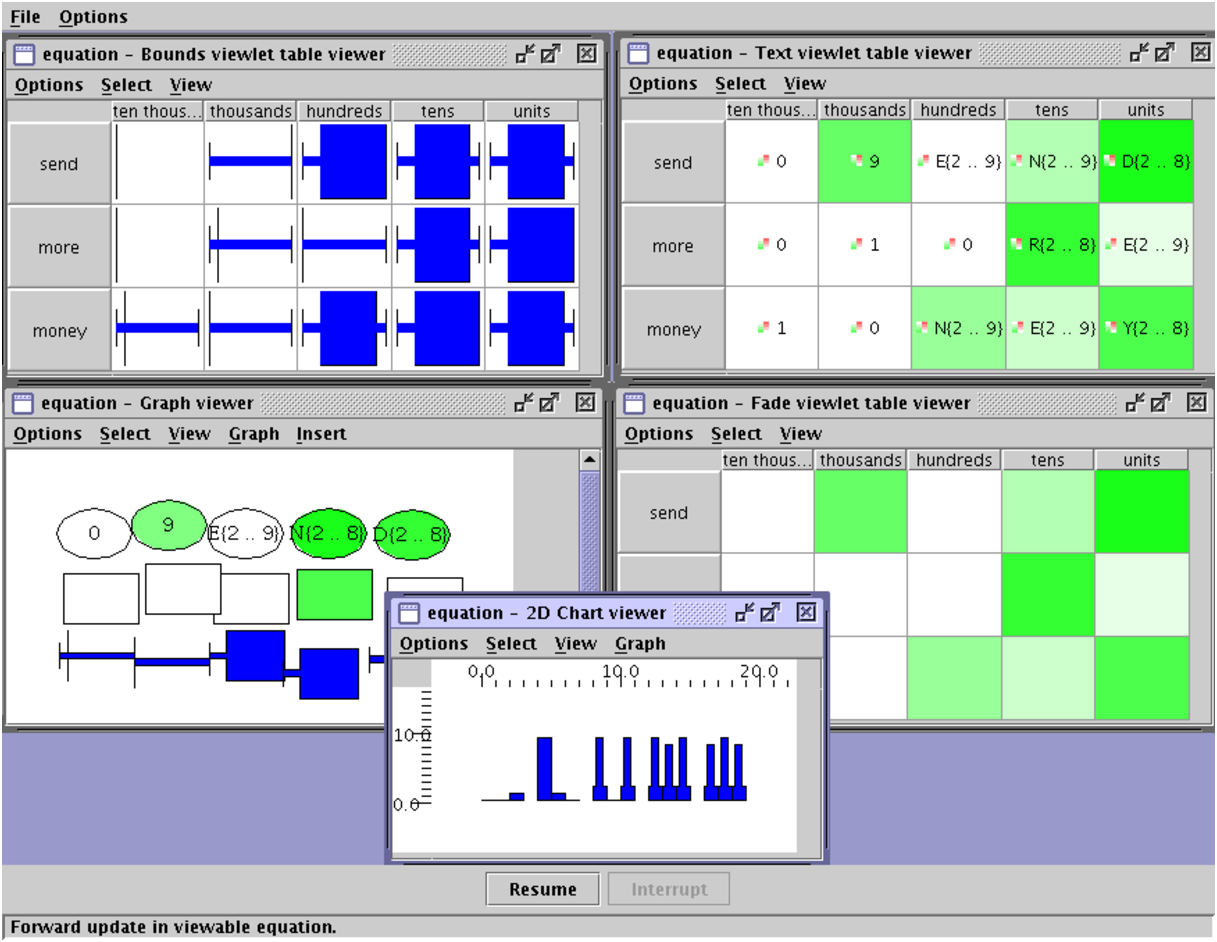
The Java VC currently contains five different methods for rendering an entire viewable. Each of these methods can be thought of as a window looking onto the viewable and is referred to as a viewer.
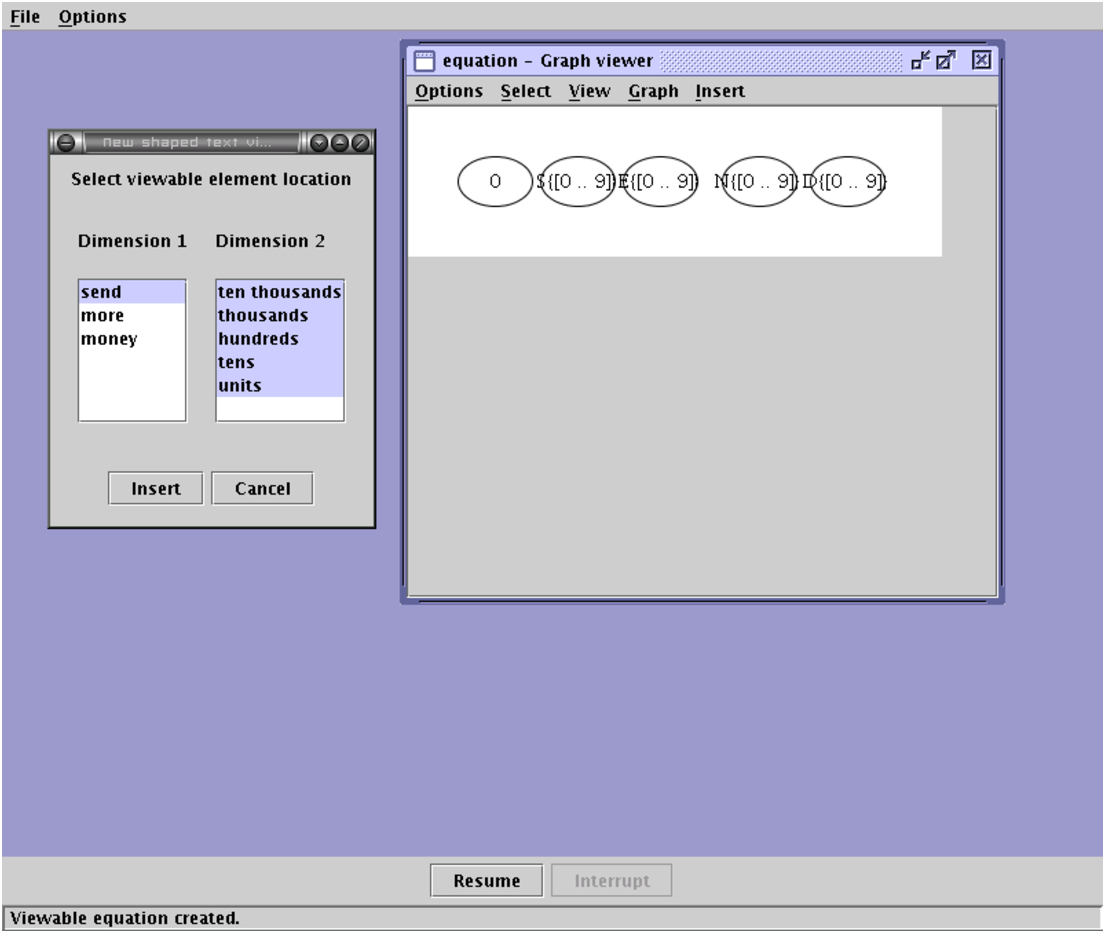
Upon a viewable being created, the user is presented with a dialog box asking which of the available viewers they wish to view the viewable with.
The currently available viewers are
Common to all viewers are the three menus Options, Select and View, the latter two also being accessible by pressing the right mouse button.
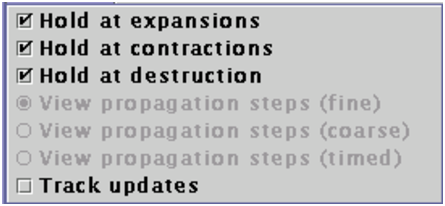
The options menu contains controls for viewer-wide properties.
Figure 3.7 shows the default settings for the Options menu. Note that the View propagation steps options are disabled because ECLiPSe has control and the update granularity can only be changed when the Java VC is holding control.
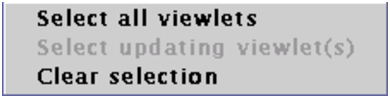
Contains convenience commands for dealing with the currently selected set of viewlets.
Selecting individual viewlets can be done clicking on them with the left mouse button, whilst selecting ranges can be done by dragging the mouse across a range of viewlets.
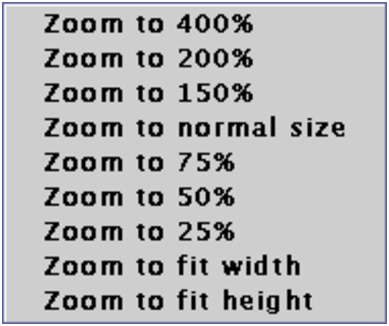
So as to facilitate visualisation of large viewables, all viewers have the ability to zoom in and out. All the options are self explanatory and will not be expanded further upon except to mention that the Zoom to fit width and Zoom to fit height options operate on the whole viewer and not just the selected viewlets.
Both the network and desktop viewers have an extra item on the view menu, Toggle high quality. This toggles between quick rendering and high quality views, and may help to make the VC more reactive under high load.
Within a viewer, as previously mentioned, any number of viewlets may be selected. These viewlets, once selected can have actions performed on them. The actions are selected by pressing the right mouse button in order to bring up the context sensitive actions menu. If the viewlets in the selection are of different types then all the available actions are displayed and once one has been selected, it will be applied to all applicable viewlets in the selection. This is a change from previous versions of the visualisation client, which would display only those actions common to all viewlets.
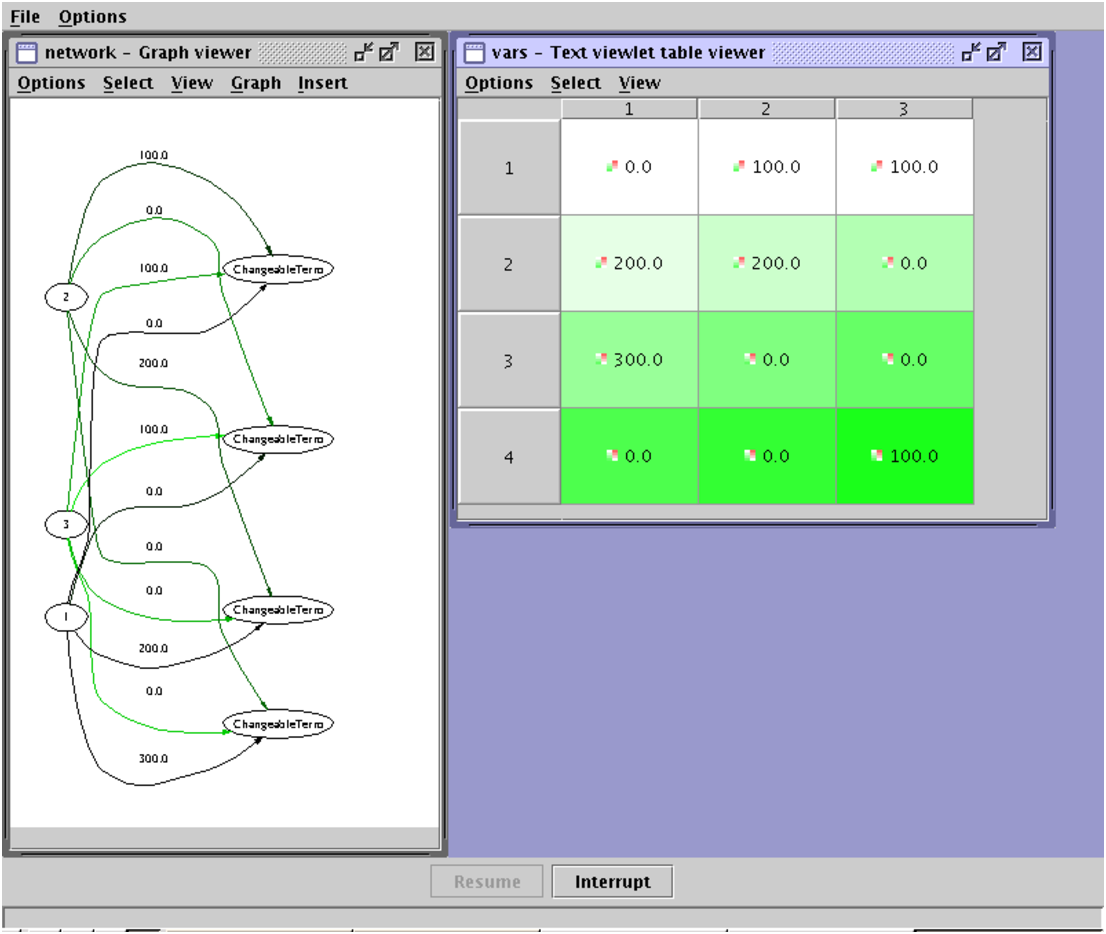
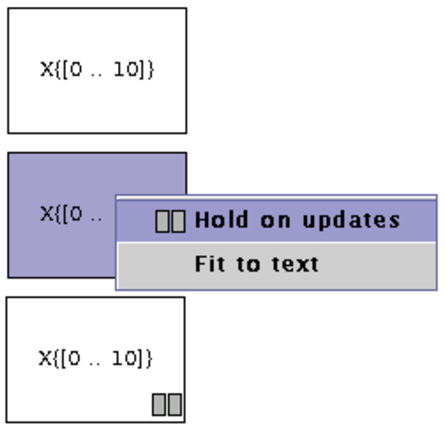
The most common action, which can be performed on any type of viewlet is the Hold on updates action, which, when set, indicates that the Java VC should hold control whenever any sort of update event is issued for the corresponding viewable element. The Hold on updates property of a viewlet is indicated by a slight “greying” out of the viewlet, or in the case of viewlets attached to edges in the network viewer, the edge is drawn “dotted” instead of solid.
Figure 3.10 shows the graphical effect of setting the Hold on update property of a text viewlet.
Table 3.2 lists the available viewlet actions and indicates for which type the actions are valid.
Name Description Applicable Hold on updates Causes the VC to hold control on forward or backward update events for the selected viewlets. all Fade update history Toggles using the background color of the viewlet to indicate recent update history. This has the effect of fading from green to white in the event of a forward update and from red to white for backward updates. text, node, fade, edge View bounds in detail Pops up a window detailing the original bounds and the current bounds for the single selected viewlet. bound Align bounds Causes the selected viewlets to use the same underlying scale when displaying the bounds. This allows variables whose initial bounds were different to be visually compared. bound Toggle horizontal/vertical range bar Toggles the rotation of the bar for all bounds viewlets bound
Table 3.2: The available viewlet actions and associated types.
All the table viewers have essentially the same functionality – they do not allow flexible placement of viewables and both deal only with 1 or 2 dimensional viewables. A more flexible viewer is provided in the Desktop viewer.
This viewer aims to implement the common desktop metaphor by providing the user with a rectangular region of the screen upon which viewlets can be dropped, stacked and moved around as though they were pieces of paper on a desk.
Typically, viewlets will be added to a desktop immediately after the viewer has been created. To minimise the overhead of having to layout the viewlets each time the user’s program is run (a potentially time consuming task), the Java VC provides an automatic recording and repeat mechanism which is triggered every time a viewer is created. Section 3.4 explains this feature in more detail.
Adding viewlets to a Desktop viewer is done by selecting the required viewlet type from the Insert menu. This menu will contain only those viewlet types which are appropriate for the type of the viewable.
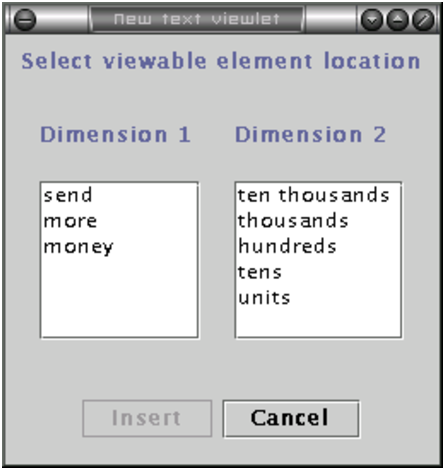
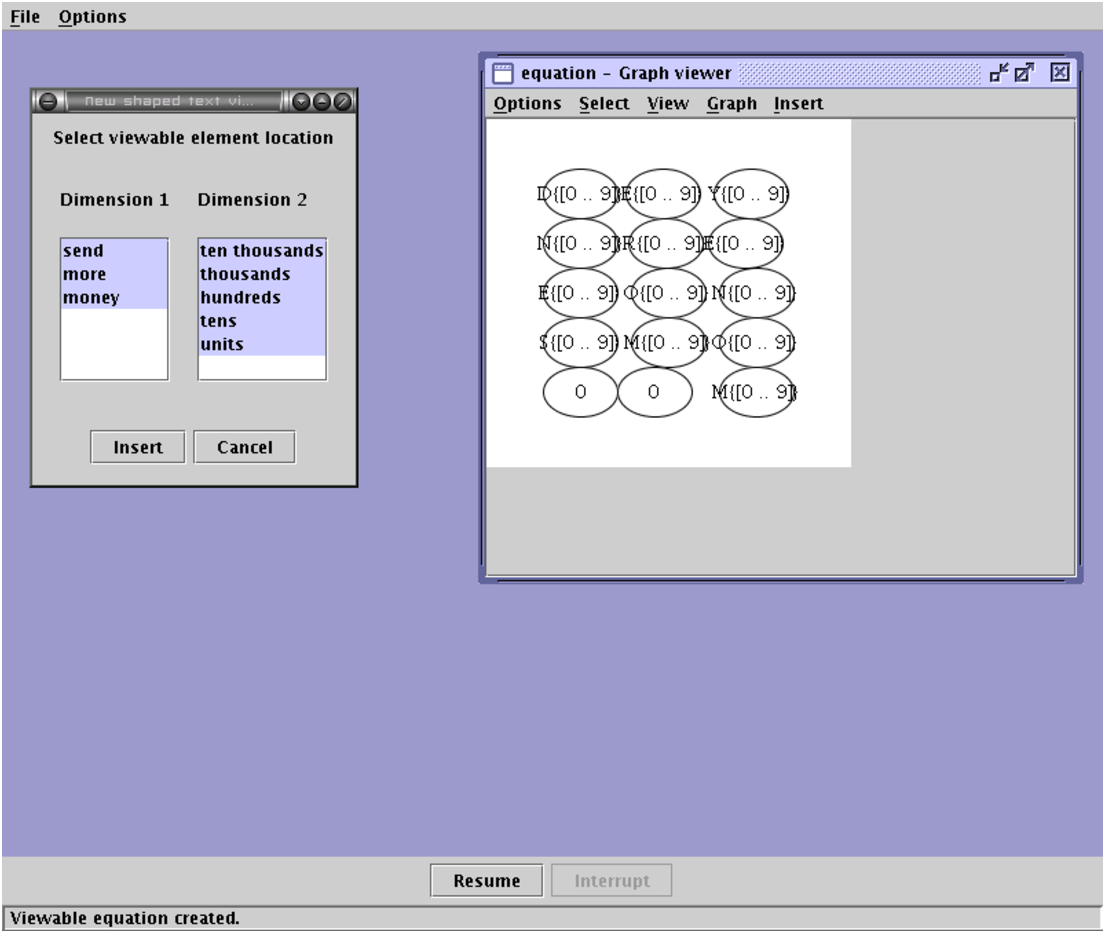
Once an appropriate viewlet type has been selected, the range selection dialog will pop up, from which any combination of dimension ranges may be selected.
Figure 3.11 shows the range select dialog for the on going SEND+MORE=MONEY example.
At least one selection must be made from each of the dimensions, though it is possible to select multiple values in each dimension.
Figures 3.12 and 3.13 illustrate the default layout of viewlets when 1 and 2 dimensional ranges are selected. The desktop will automatically resize to ensure that all viewlets fit. Attempts to move a viewlet off the desktop will cause it to grow.
Higher dimension range selections result in a stacked 2D grid, with progressive dimensions appearing underneath the initially visible grid.
As well as viewlets, the Desktop viewer can show icons loaded from disk by selecting the Image option from the Insert menu. This brings up a file selection dialog from which the user may select an image file to load. The loaded image will be added to the viewer as a small icon which is selectable and movable like other items on the desktop. Currently there is no way to increase the size of the loaded image.
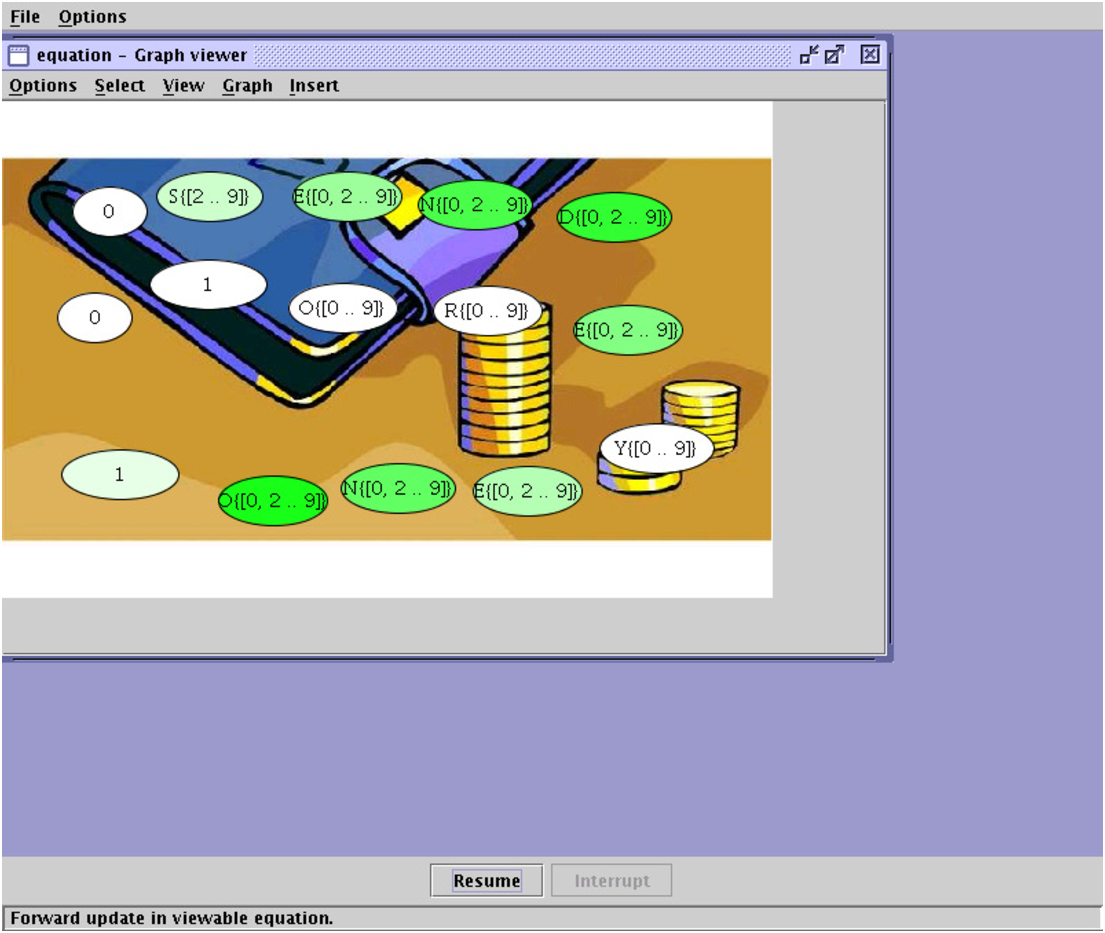
In keeping with the computer GUI desktop metaphor, the user may set the background image for the desktop viewer. Aside from making the viewer look pretty this feature is intended to allow graphical context to be associated with the visualisation of a program. For example the background image could be a diagram representing the network topology and the values being visualised could be the flows through various parts of the network. By placing the viewlets near the appropriate nodes on the background image the user could more easily visualise the network flow problem.
Background images are loaded by selecting the Import background image option from the Background menu and are removed by selecting the Clear background option. Currently only GIF, PNG and JPEG format images can be loaded.
In keeping with our SEND+MORE=MONEY example, figure 3.14 shows the problem visualised on a desktop viewer, placed over a background image1.
Items on the desktop may be manually positioned by selecting (single click) and dragging (click-and-move) them. New items may be added to the current selection by holding down the Ctrl key whilst clicking with the left mouse button. Ranges of items are selected by clicking on the background of the desktop and dragging a selection rectangle around the desired items. When dragging a selection all items move, except lines on the Network viewer.
It is also possible to use one of the automatic layout options available from the Graph menu. These options make use of the external graph layout tools dot, neato and twopi from the AT&T Labs Research project Graphviz2. These tools should be automatically installed as part of the ECLiPSe installation procedure.
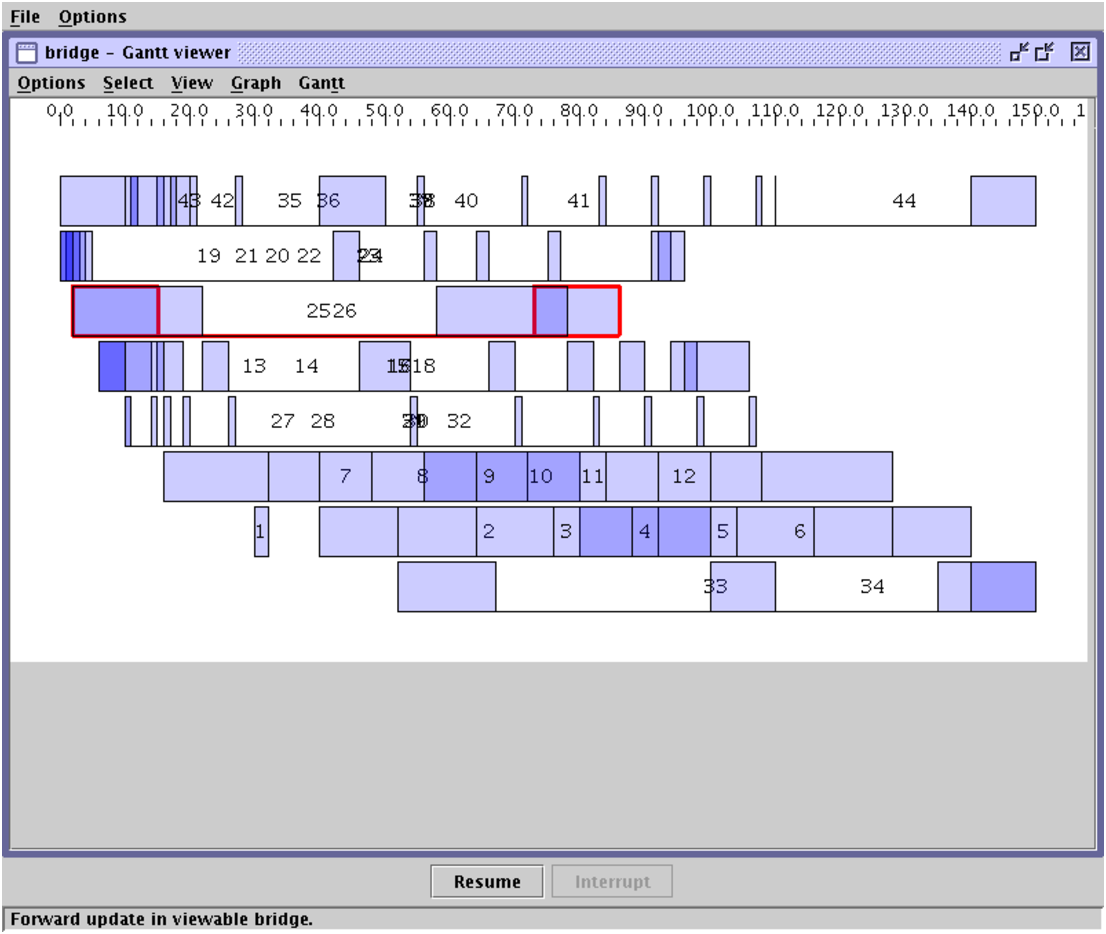
The Gantt chart viewer has many of the same options as the Network viewer previously mentioned but in addition, the Gantt menu provides access to options that control how transparent the individual gantt task bars are drawn. By selecting the transparent option, regions where tasks overlap will be rendered in a darker colour. The darker the colour, the more tasks overlap there.
When either the start time or the duration of a task is a variable, then the task will be draw as two connected bars indicating the earliest & shortest possible occurrence of the task and the latest & longest possible occurrence.
Above the gantt chart is a numeric scale indicating time. By clicking and dragging this scale can be expanded or shrunk so as to fit the gantt chart into the window. This feature works independently of the zoom.
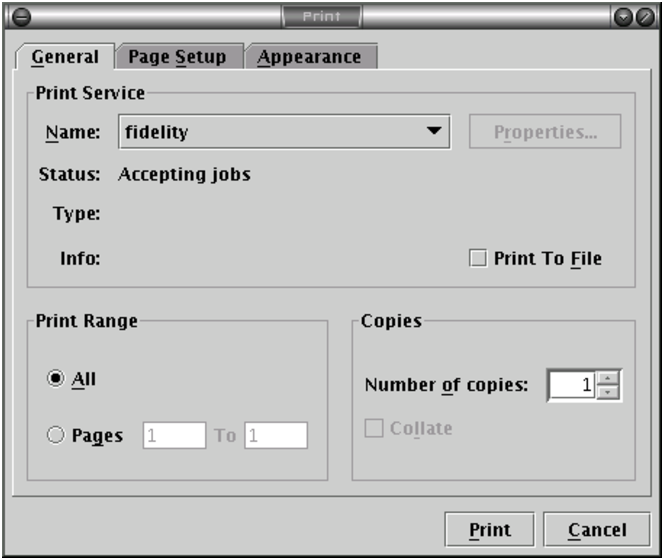
To print the current state of almost all viewers, right-click on the background and select the Print option from the popup menu. This will bring up the print dialog as shown in figure 3.16.
To make the process of setting up the visualisation environment and the laying out of viewers and viewlets quicker, the Java VC provides a record and playback feature where all user visible changes and actions that are performed following the creation of a viewable are recorded in a visualisation scenario. This action sequence can then be optionally re-played the next time a viewable of the same name is created.
The common use case is as follows.
To make long running visualisation projects easier and also to assist in running demonstrations, these visualisation preferences can be saved to disk and loaded back into memory at any time. The loading and saving of scenarios is achieved by using the Load and Save options of the File menu. The most common point at which a scenario is saved is just after laying out all the viewers and just before passing control back to ECLiPSe. It should be noted that the scenarios (settings) for many different viewables can be saved into/loaded from a single file, this is to aid visualisation of large programs.