


The main tool to debug a program is the tracer tool. The tracer is one of the development tools, all of which can be accessed from the Tools menu of TkECLiPSe. Select Tracer from the menu as shown below, and a new window for the tracer tool should appear.
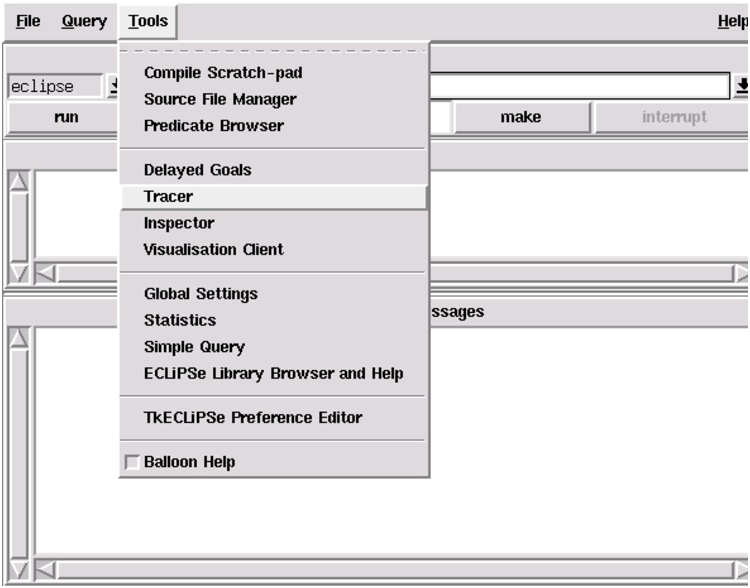
Starting the Tracer Tool
Run the query colour again. To save you from typing in the query,
you can use the up-arrow on your keyboard to step back to a previous query.
Type return when colour appears in the query window again.
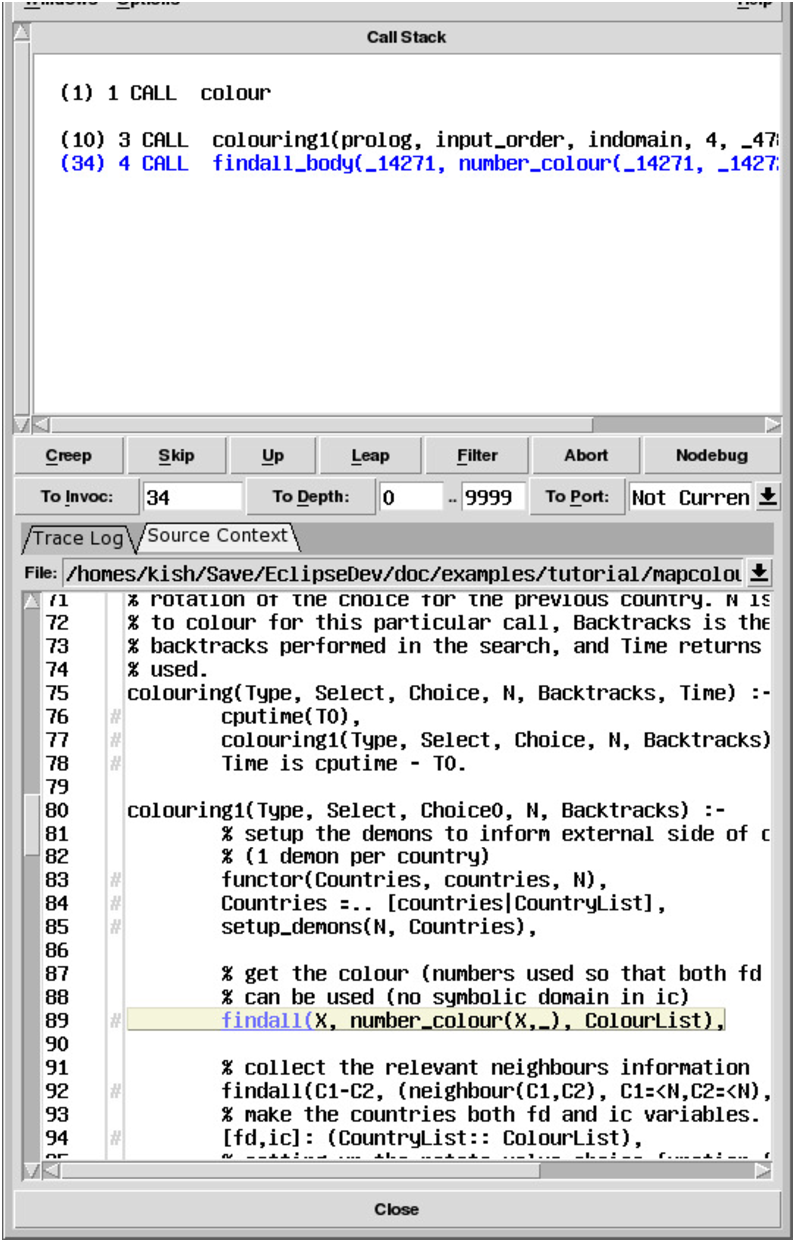
Figure 5.2: The Tracer Tool
The trace lines displayed by the tracer has the following:
 +(22) 14 *EXIT<3>  inform_colour(1, 1)

 1  2   3 4   5 6        7
- A ’+’ displayed here shows that the procedure has a spy point set. For a CALL port, a ’#’ could be displayed in this position, which shows a breakpoint is set for the call.
- The invocation number of this goal, which uniquely identifies it. The ‘To Invoc:’ button can be used to jump to the next port with the specified invocation number.
- The depth of the goal, i.e. the number of its ancestors. The ‘To Depth:’ button can be used to jump to the next port within the specified depth range.
- An asterisk before an EXIT means that this procedure is nondeterministic and that it might be resatisfied.
- The type of the port. The ‘To Port:’ button can be used to select the type of port to jump to.
- This only appears if the goal is executing at a different priority than 12, the normal priority. The number is the priority that the goal is executed at.
- The goal is printed according to the current instantiations of its variables.
Figure 5.3: Debugger Trace Line
The tracer tool traces the execution of the program, like the traditional Prolog debugger, it stops at ‘debug ports’ of predicates that are executed.
At the start of tracing,
it is stopped at the call port of the query colour. The buttons in
the middle of the tool are for debugger commands. Try pressing
Creep several times, and you should observe something similar to
Figure 5.2. Unlike the traditional debugger, the execution trace
is shown on two text windows: the bottom ‘Source Context’ view, showing the
execution of the program in the context of the source, highlighting the
body goal that corresponds to the goal at the debug port; and the
top ‘Call Stack’ window, showing the ancestors (‘call stack’) of the
current goal, which is updated at each debug port. The goals are
displayed with different colours: blue for a call port, green (success) for
an exit port. Red (failure) for a fail port. Note that in the call
stack, the ancestor goals are displayed in black: this indicates that the
goal is not ‘current’, i.e. the bindings shown are as they were when the
goal was called, and not necessarily what they are now. We will show how
these bindings can be ‘refreshed’ later on. Note that the bottom windowc
can ne switched between the source context view, and a more traditional
‘Trace Log’ view, which shows a log of the debugger ports much as a traditional Prolog debugger does.
To avoid stepping through the whole program, we will add a spy-point to a
predicate that may be causing the problem. Spy-points can be added in the
traditional way, using the spy/1 predicate. However, we can also use
the predicate browser tool: start the Predicate Browser tool
from the Tools menu of TkECLiPSe. This tool allows you to observe
and change various properties of the predicates in your program.
A list of predicates are displayed
on the left hand side, and a list of properties on the right.
Currently the predicate list is showing all the predicates defined in our program (i.e. in
the eclipse module). Looking at this list,
not_same_colour/3’s name suggests that
it checks that neighbouring countries do not have the same colour.
Select it by clicking on it, and now the right
hand side should display the properties of this predicate:
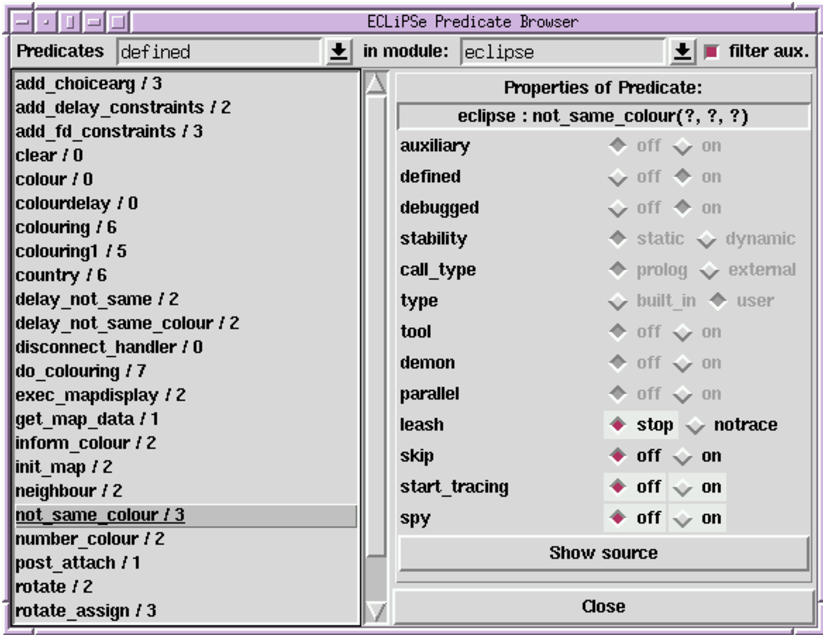
The Predicate Browser Tool
We can now view the source code for the predicate by clicking on the Show source button, which will show the selected predicate’s source in the source context view. The code for the predicate is:
|
The code does indeed check that the countries C1 and C2 do
not have the same colour.
|
The predicate browser allows us to change some of the properties of a predicate. We can add a spy-point to the predicate by clicking on the radio button for spy:

Setting Spy Property to On
With TkECLiPSe, we can do more than just place a spy point on a predicate: we can specify further conditions for when the tracer should stop at a spy point, using the filter tool.
Start the filter tool by selecting Configure filter from the Options menu of the tracer tool:
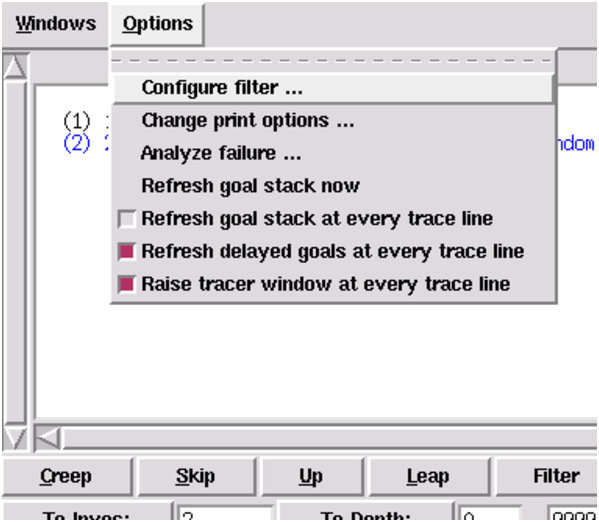
Starting the Filter Tool from the Tracer
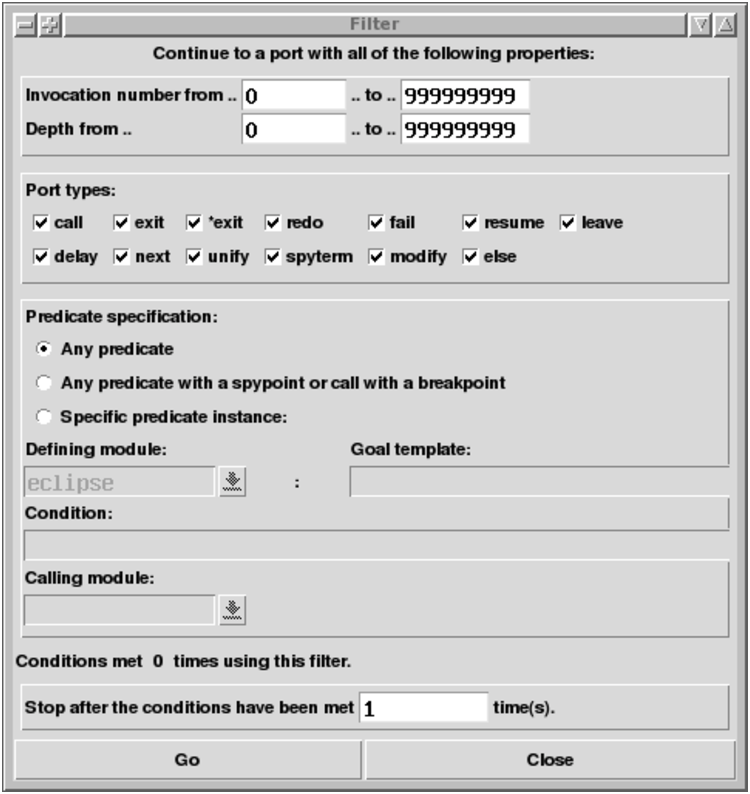
Figure 5.4: The Tracer Filter Tool
The filter tool opens in a new window, as shown in
Figure 5.4. This tool allows us to specify a ‘filter’ for the
debug ports so that the tracer will only stop at a port with the properties
specified by the tool. In our case, we want to see not_same_colour/3
only when countries 3 and 4 are involved. This can be done
with the “Predicate specification” facility, enabled by the
Specific predicate instance: radio button. Pressing this button
will allow us to specify a condition in Prolog syntax which will be
checked at each debug port. For our purpose, we enter the following:
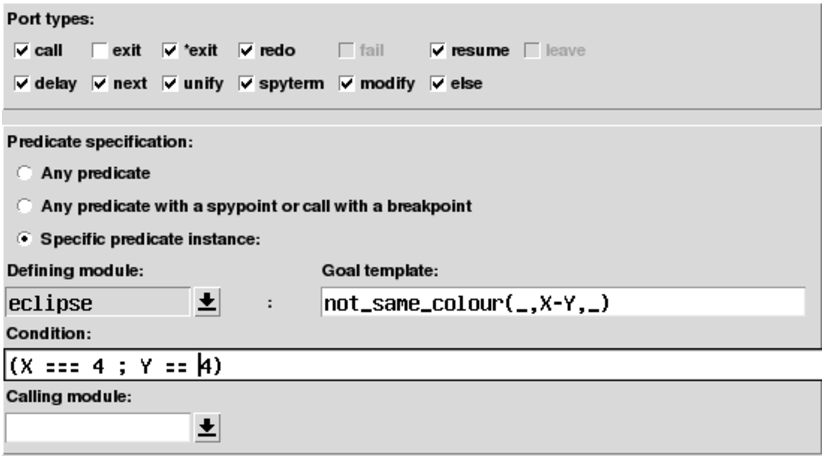
Setting Conditions for Specific Predicate Instances
This specifies that the filter should stop at a not_same_colour/3
goal, when one of the countries in the pair X-Y is country 4: the Goal template is used to specify the template the debug port goal should
match, and the Condition: can be any ECLiPSe goal, perhaps with variables
from the Goal template, as in our case. The test is done by unifying
the goal with the template, and then executing the condition. Note that any
bindings are undone after the test.
Note that we have also deselected the exit port in the filter condition. You can do this by clicking on the exit radio button. This means that the tracer does not stop at any exit port.
Press Go on the filter tool to start the tracer running with the
filter. You can also press the Filter command button on the tracer
to do the same thing.
We see that the tracer has jumped to a not_same_colour/3 goal
involving country 4 as expected. However, there is a gap in the call stack
as we skipped over the tracing of some ancestor goals. We can see these
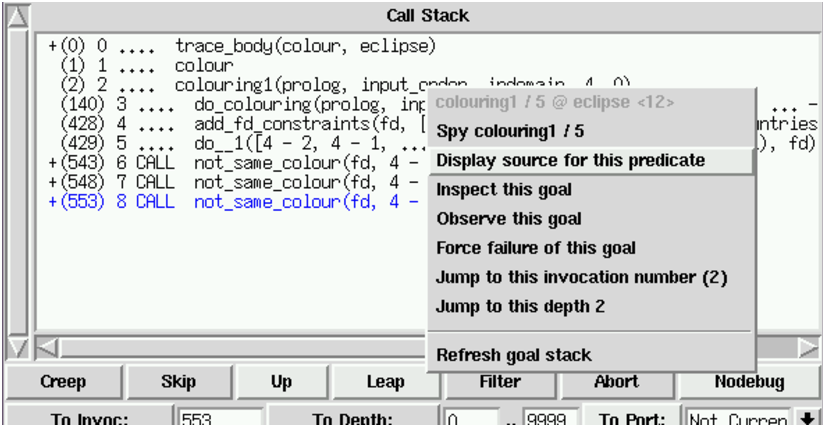
goals by refreshing the goal stack. This can be done by pressing and
holding down the right mouse button while the mouse cursor is over a goal
in the call stack, which will popup a menu for the goal:
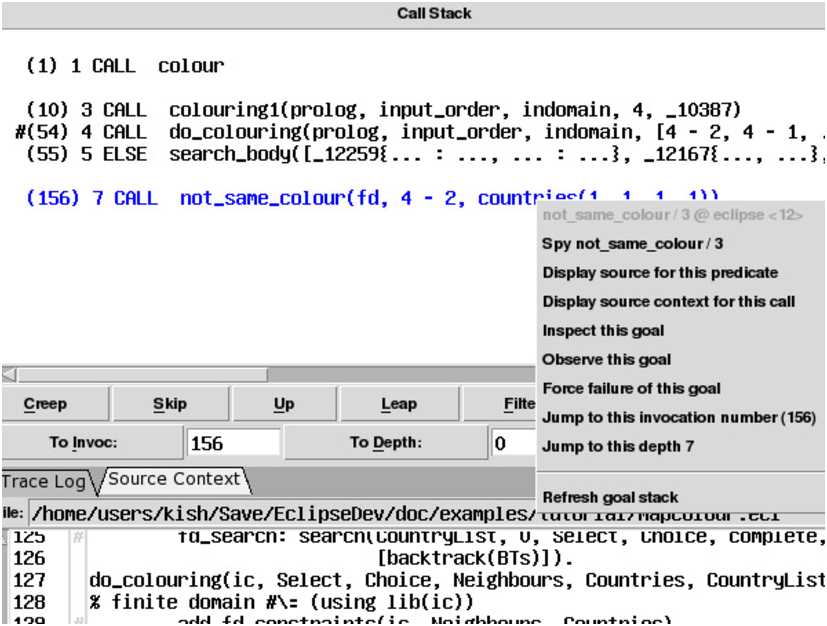
Popup Menu for a Goal in Tracer’s Call Stack
In this case, we have opened the menu over not_same_colour/3, and the
options are for this goal. Various options are available, but for now we
choose the Refresh goal stack option. This will result in the
following goal stack display:
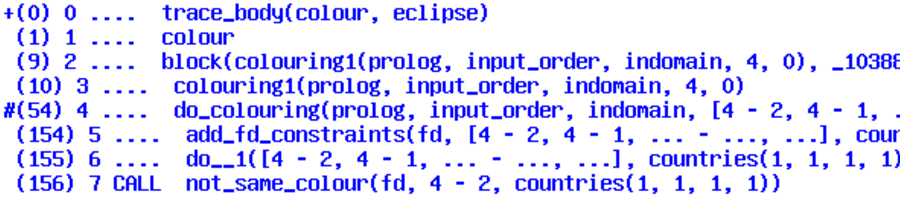
Refreshed Call Stack
Notice that the colour of the goals in the goal stack are now all blue, indicating that the bindings shown are current.
Press Filter on the tracer several times to jump to other ports
involving country 4. You will see that none of them involve countries 3 and
4. So perhaps countries 3 and 4 are not checked by
not_same_colour/3, i.e. 3-4 or 4-3 are never passed
to not_same_colour/3. Looking at the call stack, we can see that the
country pair in not_same_colour/3 seem to appear as an element in a
list of country pairs, as far back as colouring(...). Unfortunately,
the debugger does not display the whole list. We see something like:
do_colouring(prolog, input_order, indomain, [4 - 2, 4 - 1, ...
due to the ‘print depth’ feature, which shortens the printing of large
terms. We can examine the whole list by using the inspector to examine the
goal. To do this, we double click on the do_colouring(...) goal
to ‘open’ it for inspection.
This will launch the Inspector tool on the do_colouring goal. The
inspector displays the term in a hierarchical fashion as a tree, which
allows us to navigate the term. The initial display is shown on the left
panel below. We are interested in examining the full list. We can look at
this list by double clicking on it to expand the node, which results in the
display in the right panel below. You may need to scroll
down to see the whole list:
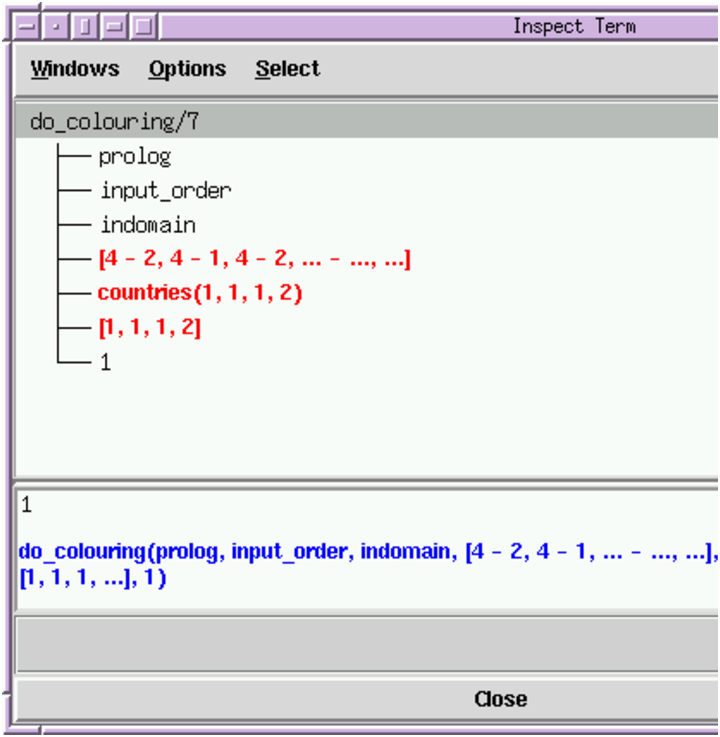
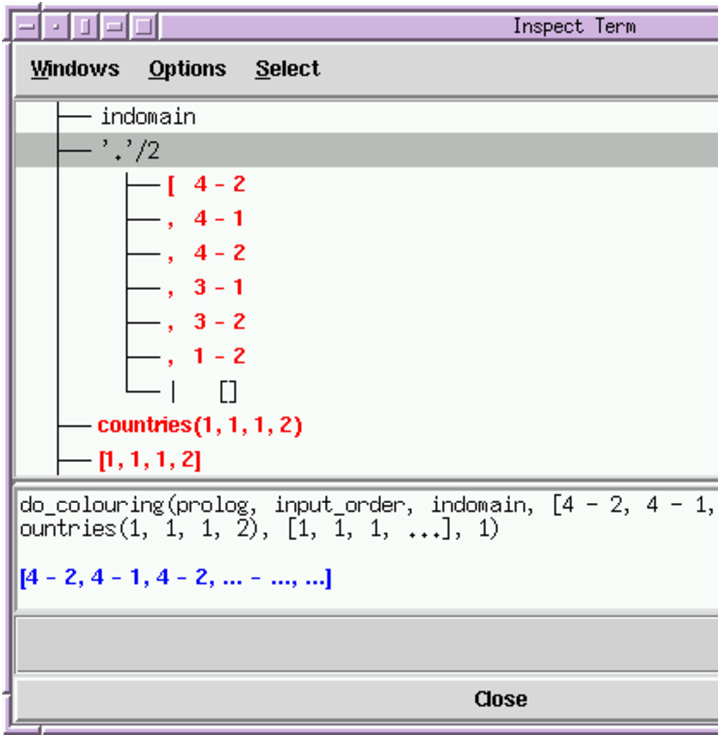
Using the Inspector
The inspector shows that this list does not contain the pair 4-3 or
3-4, which should be there so that not_same_colour
can check that these two countries are not assigned the same colour.
The inspector tool is modal – when it is open, the rest of TkECLiPSe is
inaccessible. Close the Inspector by clicking on its
Close button, go back to the tracer, and see where the country
pair list comes from. It
first appears in
the ancestor goals do_colouring(prolog,...), as the next parent
colouring(prolog,...) does not have this list. So the list
is created in a body goal of colouring(...) before do_colouring(...) is
called. We can look at the source of colouring(...) to see how this
list is created. To do this, we can
select Display source option from the popup menu for the
colouring(...) goal:
Displaying Source for a Goal in the Call Stack
The code for this predicate is quite long, but for our purposes we are only
interested in the country-pair list that is passed to do_colouring:
|
Looking at this source and the Call stack goal, we can see that the country
pair list is constructed from neighbour/2 calls. Let’s look at the
source for neighbour/2. We can do this from the predicate browser, by
selecting neighbour/2 and pushing the Show source button. We see
the following:
neighbour / 2 in file buggy_data.map, line 2: %neighbour(4, 3). neighbour(4, 2). neighbour(4, 1). neighbour(4, 2). neighbour(3, 1). neighbour(3, 2). neighbour(1, 2). |
So neighbour(4,3) was indeed missing (it is commented out).
Another way to check neighbour/2, without looking at the source,
would be using the
Simple Query tool. This tool is again started from TkECLiPSe’s
Tools menu. It can be used to send simple queries to ECLiPSe,
even while another query is being executed (as we are here, executing the
colour query). We can use this tool to check if neighbour(4,3)
or neighbour(3,4) are defined or not:
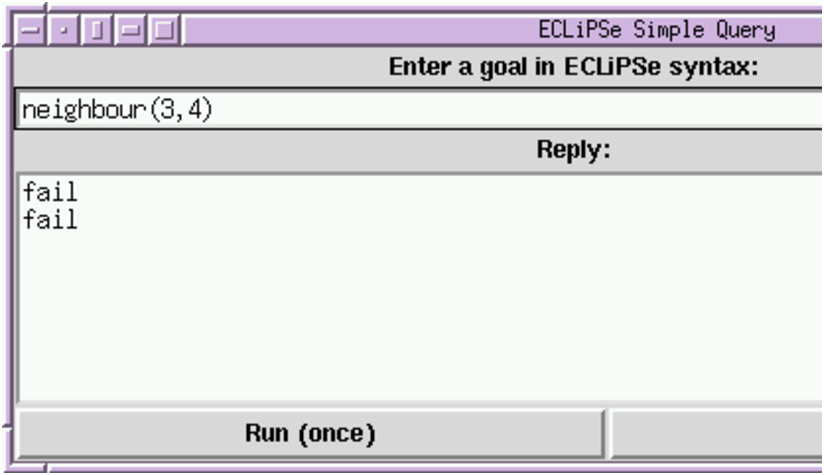
The Simple Query Tool
To send a query, simply type it in the entry window and press return, and
the reply will be sent to the reply window. In the example above, we have
tried neighbour(4,3), followed by neighbour(3,4), and
both failed, indicating that there is no neighbour relationship defined
between countries 3 and 4.
We can fix the program by editing
the file buggy_data.map and adding the neighbour(4, 3) line back.
TkECLiPSe does not provide an integrated editor itself, so you need to use
some external editor, such as emacs, vi, or wordpad to edit the program.
You can tell ECLiPSewhich editor you want to use, so that you can invoke
the editor from within ECLiPSe. For example, from the source context view
window of the tracer, you can invoke an editor to edit the file being
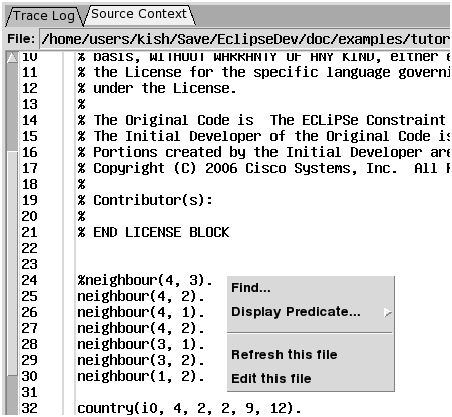
Figure 5.5: Invoking an editor
displayed. Holding down your right mouse button in the source context window will popup a menu, as shown in figure 5.5. Select “Edit this file” option will invoke your specified editor to edit the file, and if possible, the file will be opened showing the line where your mouse pointer was when you popup the menu (line 24 in this example).
|
To run the corrected program, we first end our current debugging session by closing the tracer window. You can see from the map display that the execution continues until a solution is produced. Pressing Done on the map display will return control to ECLiPSe. Alternatively, if continuing the execution is undesirable, press the Abort command button in the tracer, which would abort the execution.
Once we have made the correction to the program and saved it, we compile it by pressing the Make button on TkECLiPSe. This recompiles any files that have been updated since ECLiPSe last compiled the file.
Running the program again will show that the bug is indeed fixed.
In TkECLiPSe, you can usually perform these operations on an object while the mouse cursor is over it:
- left-click
- selects the object.
- double (left)-click
- ‘opens’ the object. This can mean expanding it (e.g. in the inspector), or calling the inspector on it (e.g. on a goal in the call stack), or showing the source for a goal (e.g. in the source context view).
- Right-click and hold
- Opens a menu which gives further option/information on the object.
Right-mouse button functionality are alternatively available through the left-mouse button with the control key pressed.
Figure 5.6: Mouse Button Operations on Objects
- Compile scratch pad
- allow simple programs to be written and compiled. Equivalent to [user] in command line ECLiPSe.
- Source file manager
- manage source files for this ECLiPSe session.
- Predicate browser
- view/change properties of predicates.
- Delayed goals
- view delayed goals.
- Tracer
- debugger for ECLiPSe programs.
- Inspector
- term inspector. Useful for viewing large terms.
- Visualisation client
- start a visualisation client.
- Global settings
- view/change global ECLiPSe settings.
- Statistics
- show statistics. Information is updated dynamically.
- Simple query
- send simple queries to ECLiPSe.
- Library browser and help
- interface to ECLiPSe documentation.
- TkECLiPSe preference editor
- view/change TkECLiPSe settings.
Figure 5.7: Available Development tools